How Negative online are you.
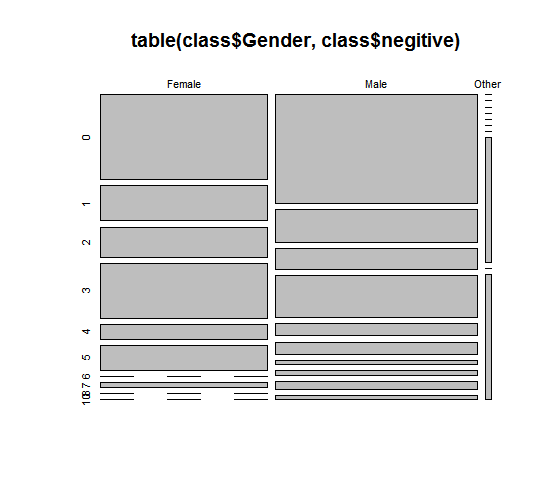
This Mosaic plot is about men and women that have been negative online. There is a lot of men and women that are not negative online at all. However, there is a little difference because men are a little more negative online and they are more spread out since they reach up to 10 on the scale.
How much time for work
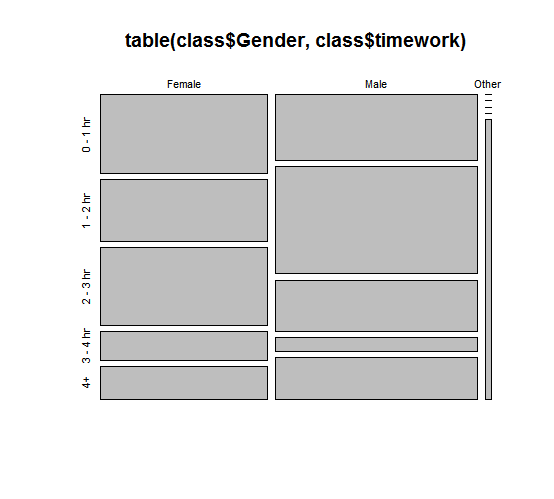
This Mosaic plot shows the difference between the genders online when it comes to work. This graph explains that males are the ones who generally spend more time online than women evne though it isn't a big difference. More women tend to spend 0-1 hours online working than men, but as the times increase the amount of women who spend time working is less than the men's.
How much time are you on social media
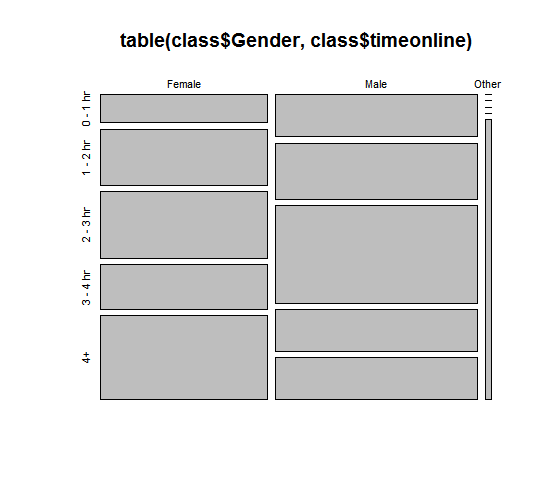
This Mosaic plot is about men and women that are on social media. There seems to be a large amount of women compared to men going 4+ hours for social media. While there are a lot more men going on 2-3 hours for social media.