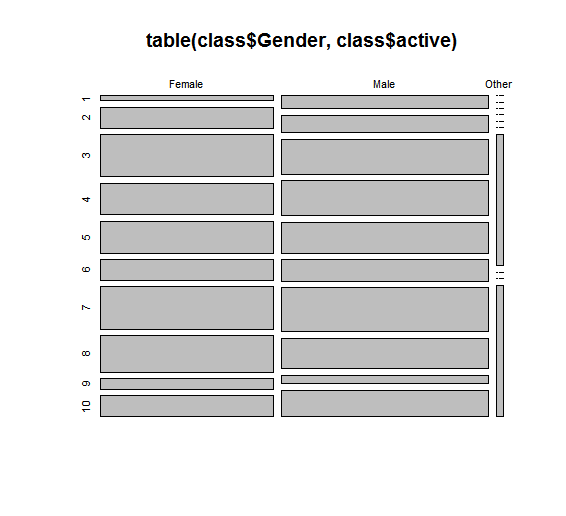
This mosaic plot shows how active each gender is online. This graph shows that there really isn't a huge difference between the activeness of genders online. Looking at this graph supports our hypothesis that genders interact just as much as the opposite gender online because there is little to no difference between the responses.
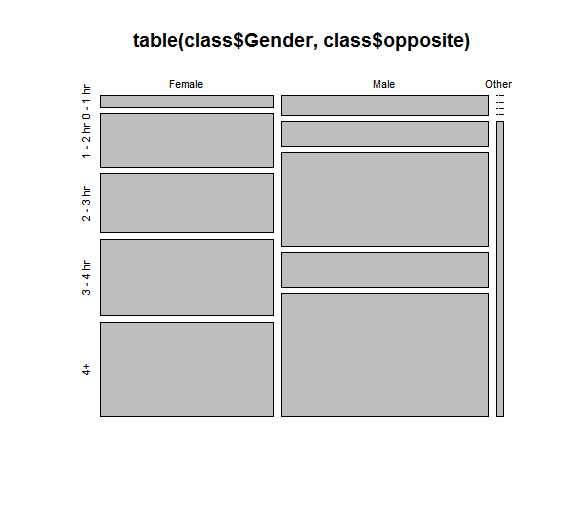
Here is another mosaic plot in order to show how active one gender thinks the opposite gender is online. This plot conveys the fact that males think females spend more time online, but in reality they actually spend the same amount of time online as shown in the previous graph.
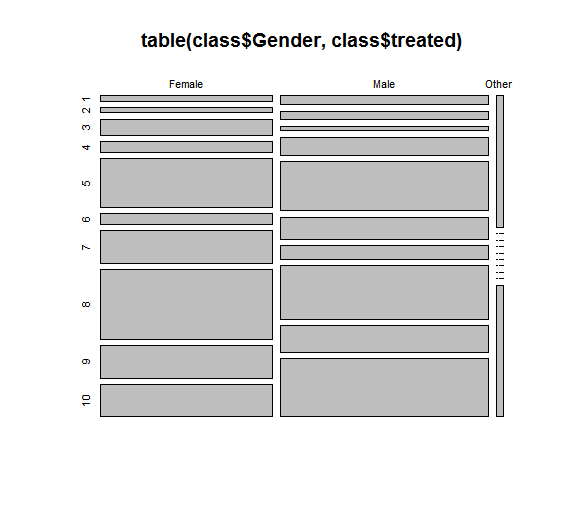
In this mosaic plot, it can be seen that there may be some differences between how women and men are treated online, but not a big enough difference to support that they are different. Since the way each gender is treated then it can be said that there is no difference between genders online.
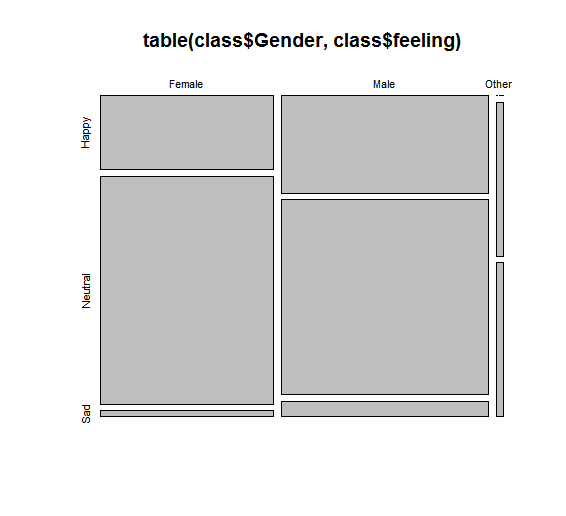
As shown in this graph, a majority of both genders are feel neutral after going on social media. However, it looks like that there are more males who are happy and sad, so maybe there is a difference between the genders even if it is just a little difference.
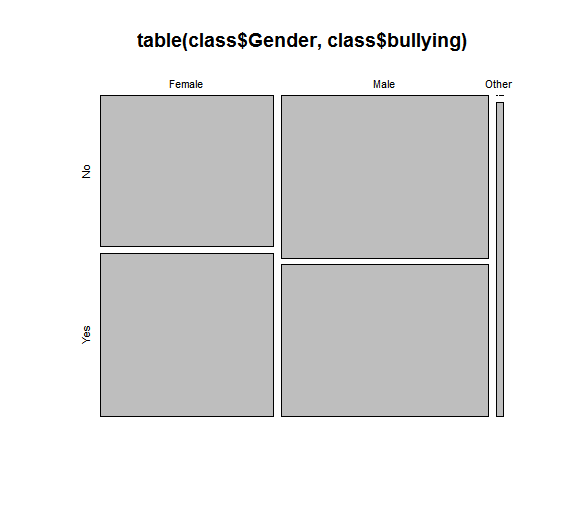
This graph shows how many females and males are subjugated to cyber bullying. There is a slight difference in the numbers because more women seem to have experienced cyber bullying than men.
Introduction